
Part III: Stretched Valuations
Below is a table listing 25 companies in the AI space and their trailing 12-month price to earnings ratios (TTM P/E) at the time of writing. [1]
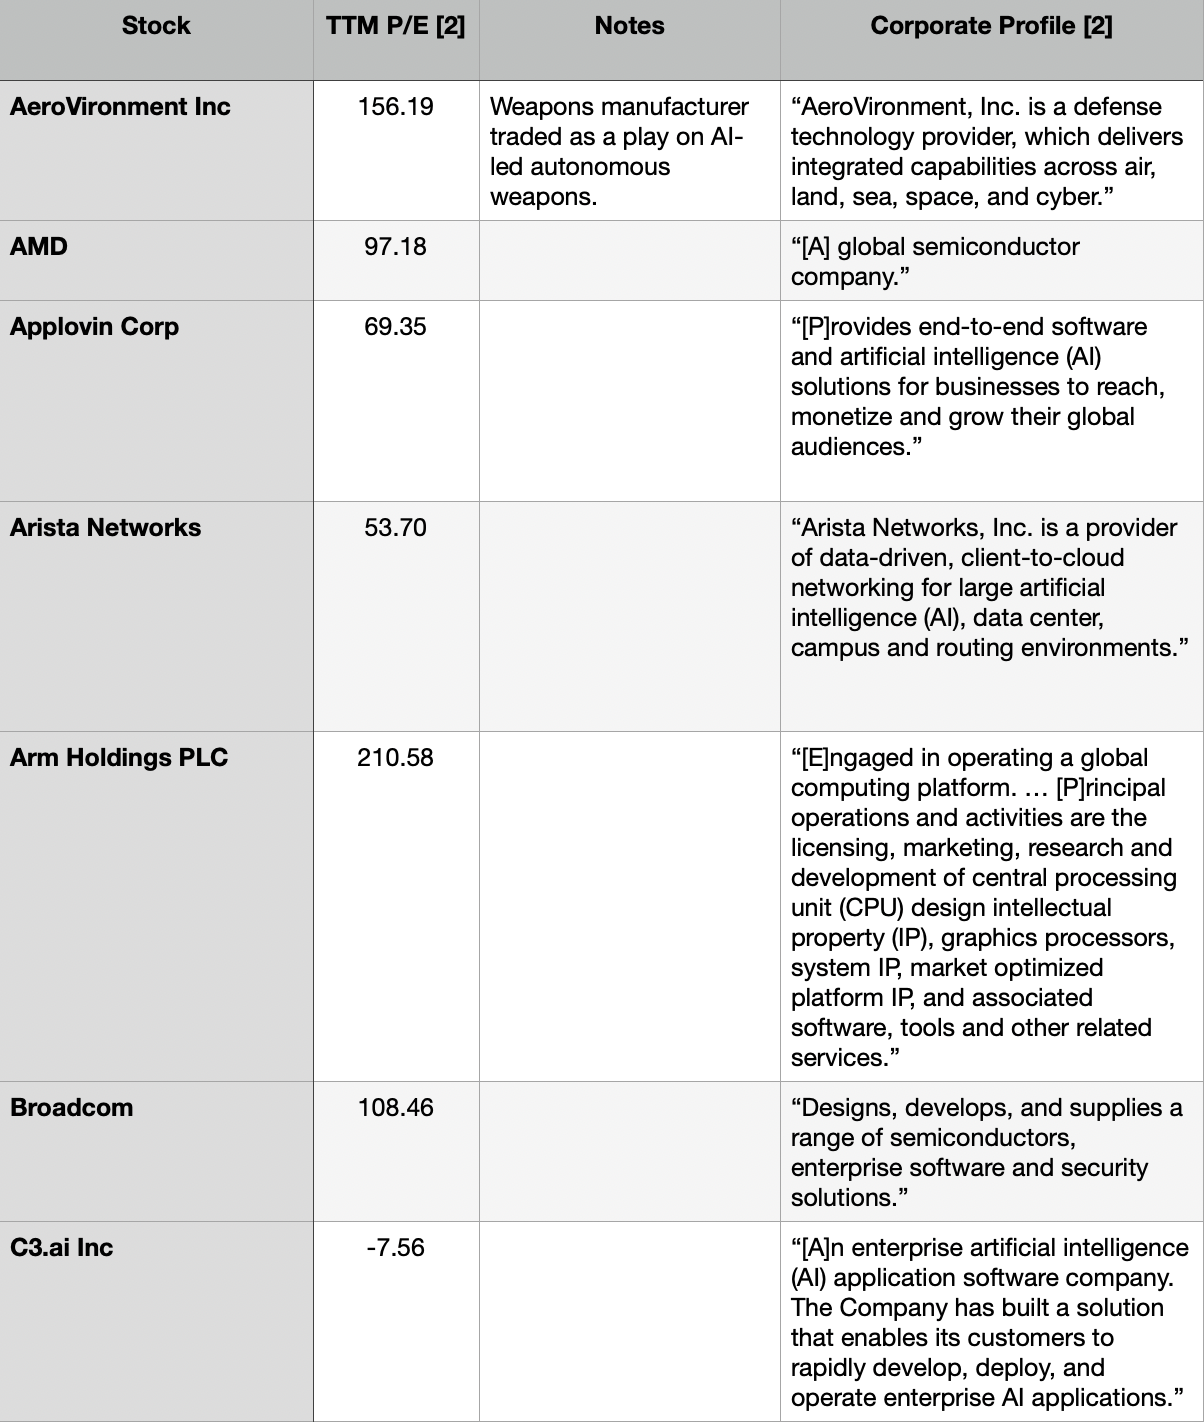
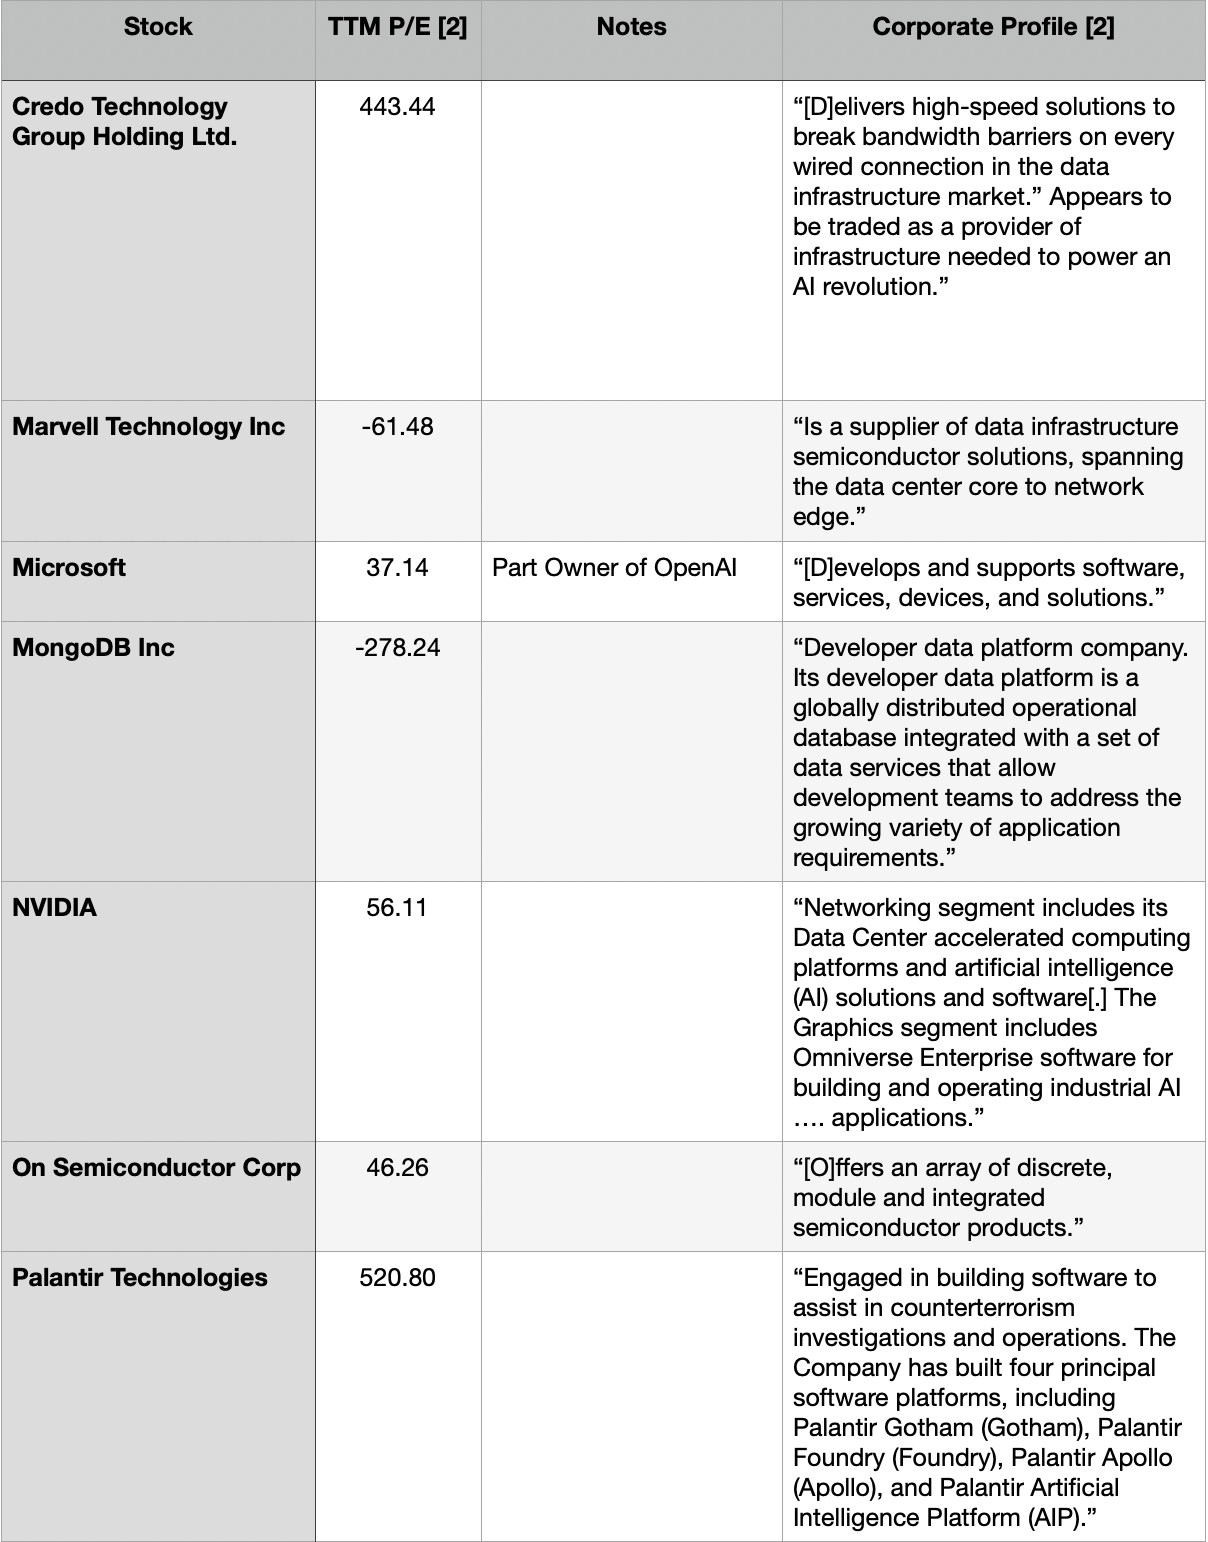
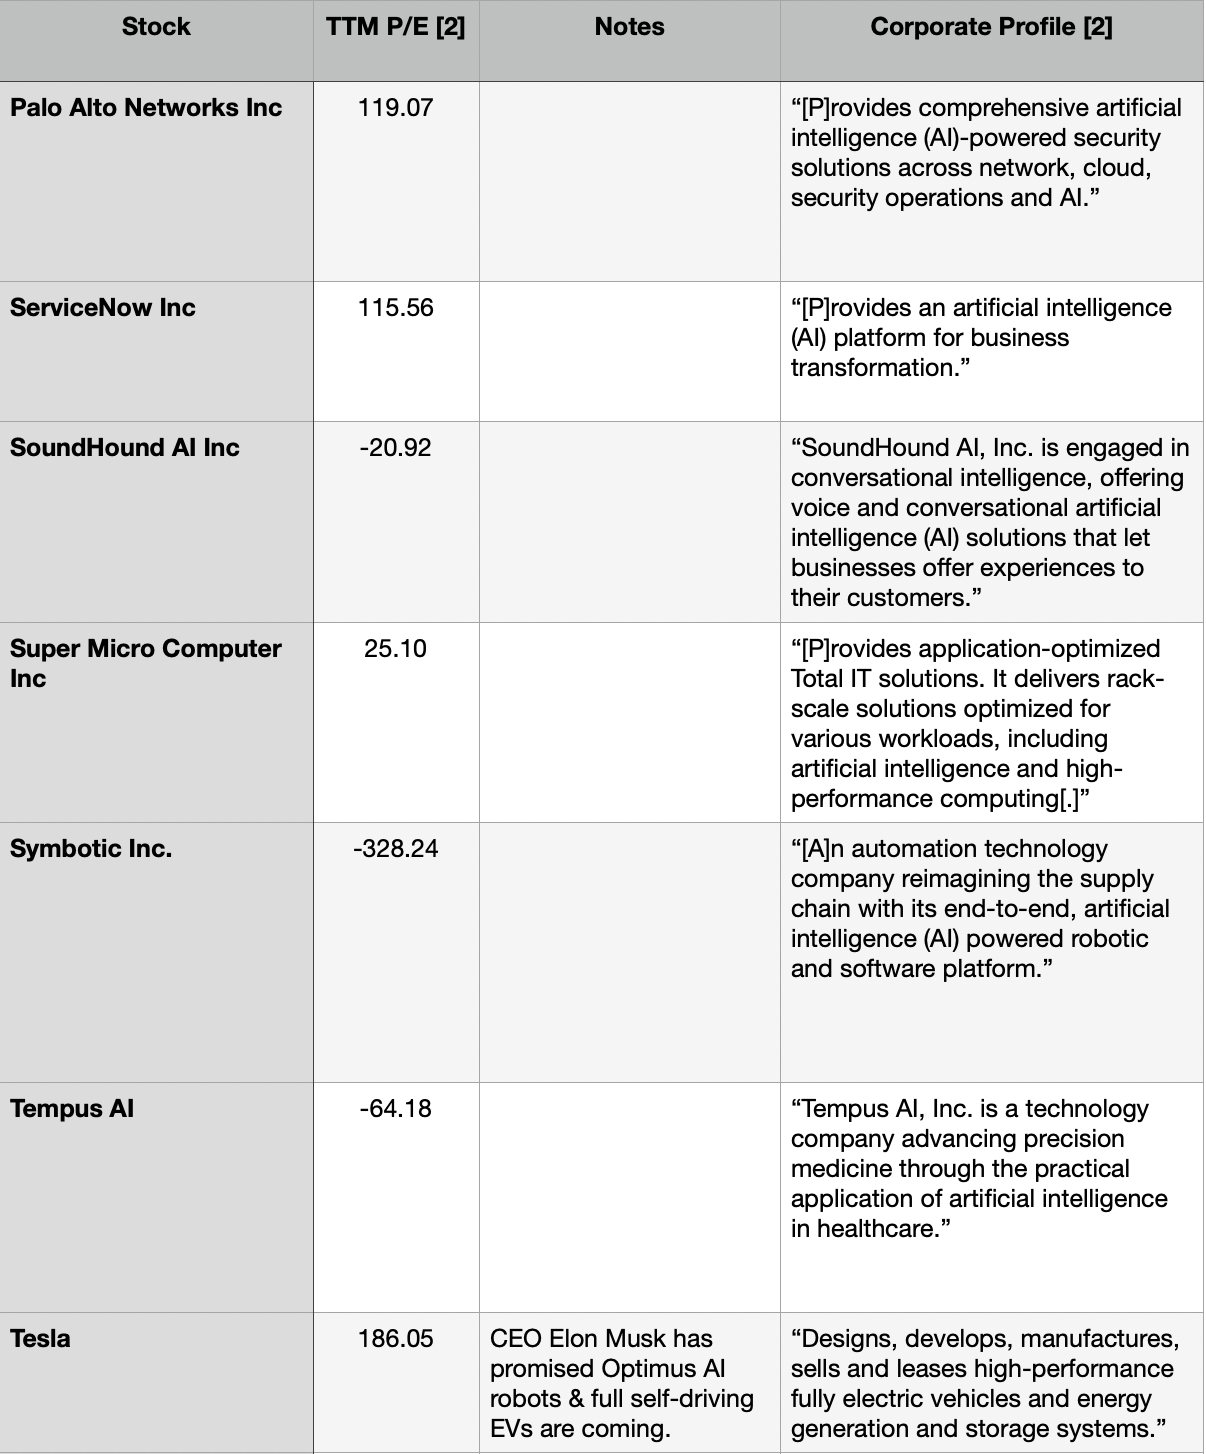
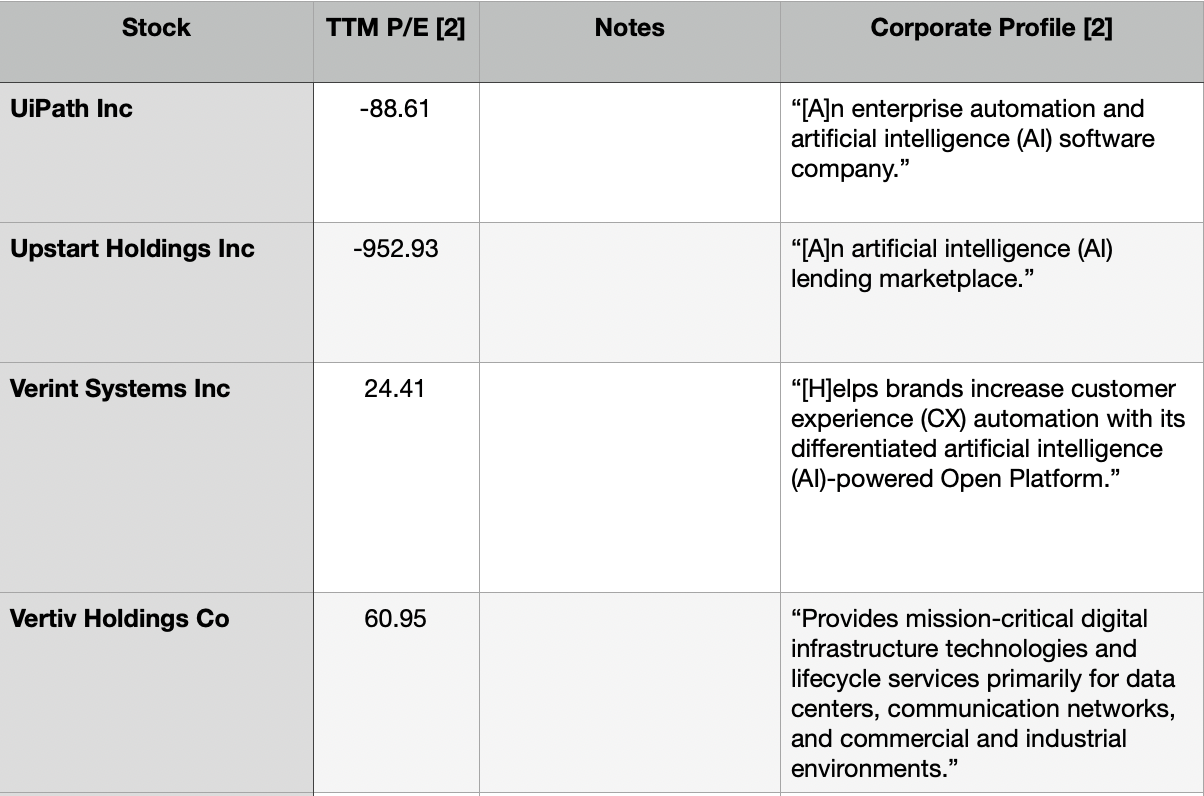
As the table shows, stocks in the AI space are trading at gigantic valuations, with P/E’s reaching into the hundreds in some instances.
The stocks have run up to these heights on the belief that generative AI will power the profits of the underlying companies ever-higher.
And it’s not just individual stocks tied to the AI hype that are carrying stretched valuations: the market broadly is trading at valuations only seen once since the dot-com bubble. The graph below depicts the forward price to earnings (P/E) ratio of the S&P500 as of July 31, 2025. [3]
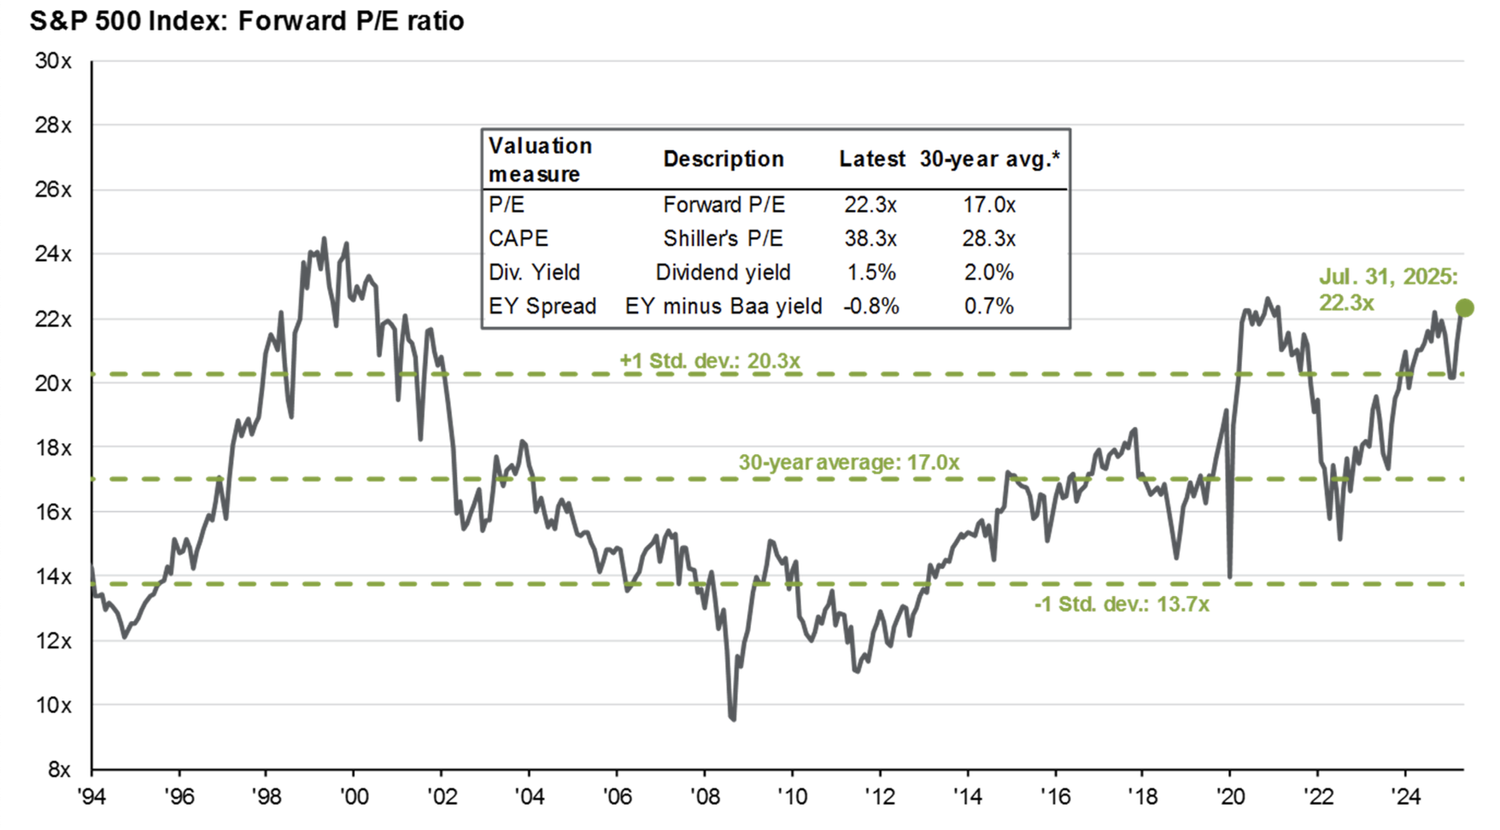
Graph via JP Morgan Asset Managment.
The one other time since the dot-com bubble that S&P500 forward valuations have been this stretched? The height of the meme-stock frenzy in 2021. And as the chart indicates, that frenzy ended in a roughly 20% drop in the market in 2022.
The market may seem calm, but under the surface, trouble is brewing.
Footnotes
[1] August 31, 2025
[2] P/E ratios and business profiles per CNBC.com
[3] The S&P500’s forward P/E has risen further to 23.99 as of August 29, 2025.